Task 2: Check the Status of the httpd Service
Httpd is the service for the Apache http server that was installed on my
host. This is a lightweight web server like the ones that run your
favorite websites (think let's ... say amazon.com). In this exercise I
checked the status of the httpd service, and started it using the
systemctl command and verified the service was working.
Helpful Hint
I had to use sudo to complete this exercise since I was not root.
I checked the status of the httpd service by using the systemctl
commands as shown below:
sudo systemctl status httpd.service
The command prompt showed the output after entering sudo systemctl
status httpd.service.
The command sudo systemctl status httpd.service and the output said that
the httpd service section was inactive (dead).
This indicated that the httpd service was
loaded, which means it was installed and ready to work
but was inactive.
So the next step was to start it. I checked the status of the httpd
service by using the systemctl commands as shown below:
sudo systemctl start httpd.service
I checked again the status of the httpd service by using the systemctl
commands as shown below:
sudo systemctl status httpd.service
The command prompt showed the output after entering sudo systemctl
status httpd.service.
The command sudo systemctl status httpd.service and the output said that
the httpd service section was active (running).
Now that the httpd was running, I checked it worked correctly. I opened
a new tab on my browser and entered: http://<publicip>. I replaced
<publicip> with the public ip that I retrieved at the beginning.
When httpd was successfully running, an Apache Test page appeared with
general information about the proper operation of the Apache HTTP
server.
I then stopped the service by entering the command below:
sudo systemctl stop httpd.service
Task 3: Monitoring a Linux EC2 instance
In this exercise I used Linux commands to monitor the Amazon Linux2 EC2
instance. I also opened the AWS Console and logged into CloudWatch to
see how this service could provide me with data to monitor my instance.
Helpful Hint
I had to use sudo to complete this exercise since I was not root.
I displayed the list of running processes by entering the command below:
top
When running the command top, the output showed the current running
processes and resource usages.
Top displayed the processes currently running as well as the resource
usage like CPU usage and memory usage. I hit Q to exit
and return to the shell.
In the next step I ran a script that simulated a workload on the CPU. I
ran the stress.sh script that simulated a heavy workload on the EC2
instance by entering the following command:
./stress.sh & top
As in step 1, I displayed the list of running processes by entering the
top command.
I could see that the process I just ran had a high CPU usage. The script
was designed to run for 6 minutes, before stopping.
In the next steps I opened the
AWS Management Console and started the
AWS CloudWatch application that gave me better insight
into my EC2 instance.
On the top right of my screen I selected the AWS button. This displayed
the AWS Management Console in a new tab.
In the Search bar on the top of the screen, I entered CloudWatch and
pressed ENTER.
The AWS console includes a search bar that you can use to search for
services.
On the left section of the navigation pane, I selected Dashboard, then
selected Automatic dashboards. In the Automatic dashboards list, I
selected EC2.
I could see that by default the
EC2 CloudWatch dashboard displayed several metrics such
as the CPU utilization, Disk reads and writes...
I could see a spike in the CPU utilization that matched the time when I
started the stress script earlier.
Dashboards are customizable so you can add or remove widgets, reorganize
them, customize colors... AWS CloudWatch offers many
more features such as alarms or events triggers that you will discover
later that makes it a key AWS Service to monitor your
applications in real time. Update the 5 minutes average to 1 second to
second review updates more quickly.
I waited 5 minutes and went back to the AWS CloudWatch dashboard. I saw
that the CPU utilization dropped.
By default AWS CloudWatch aggregates data for 5 minutes before
processing them. This is setup that can be changed
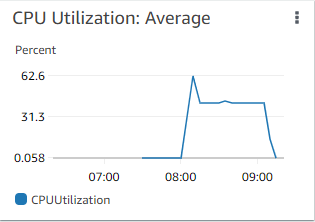 CPU Utilization after five minutes in Cloudwatch Dashboard
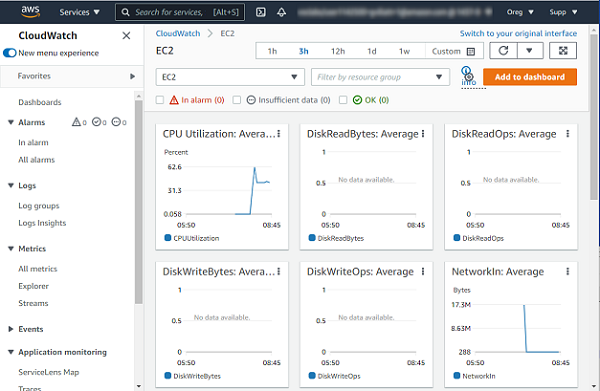 CloudWatch Metrics for Instance
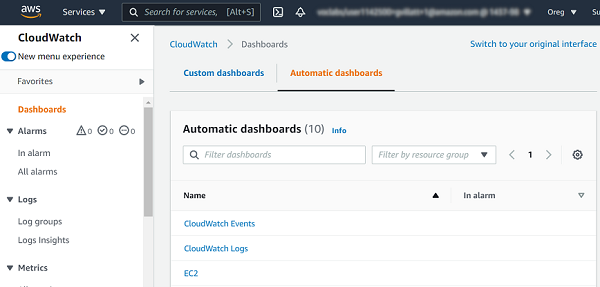 Automatic Dashboards list
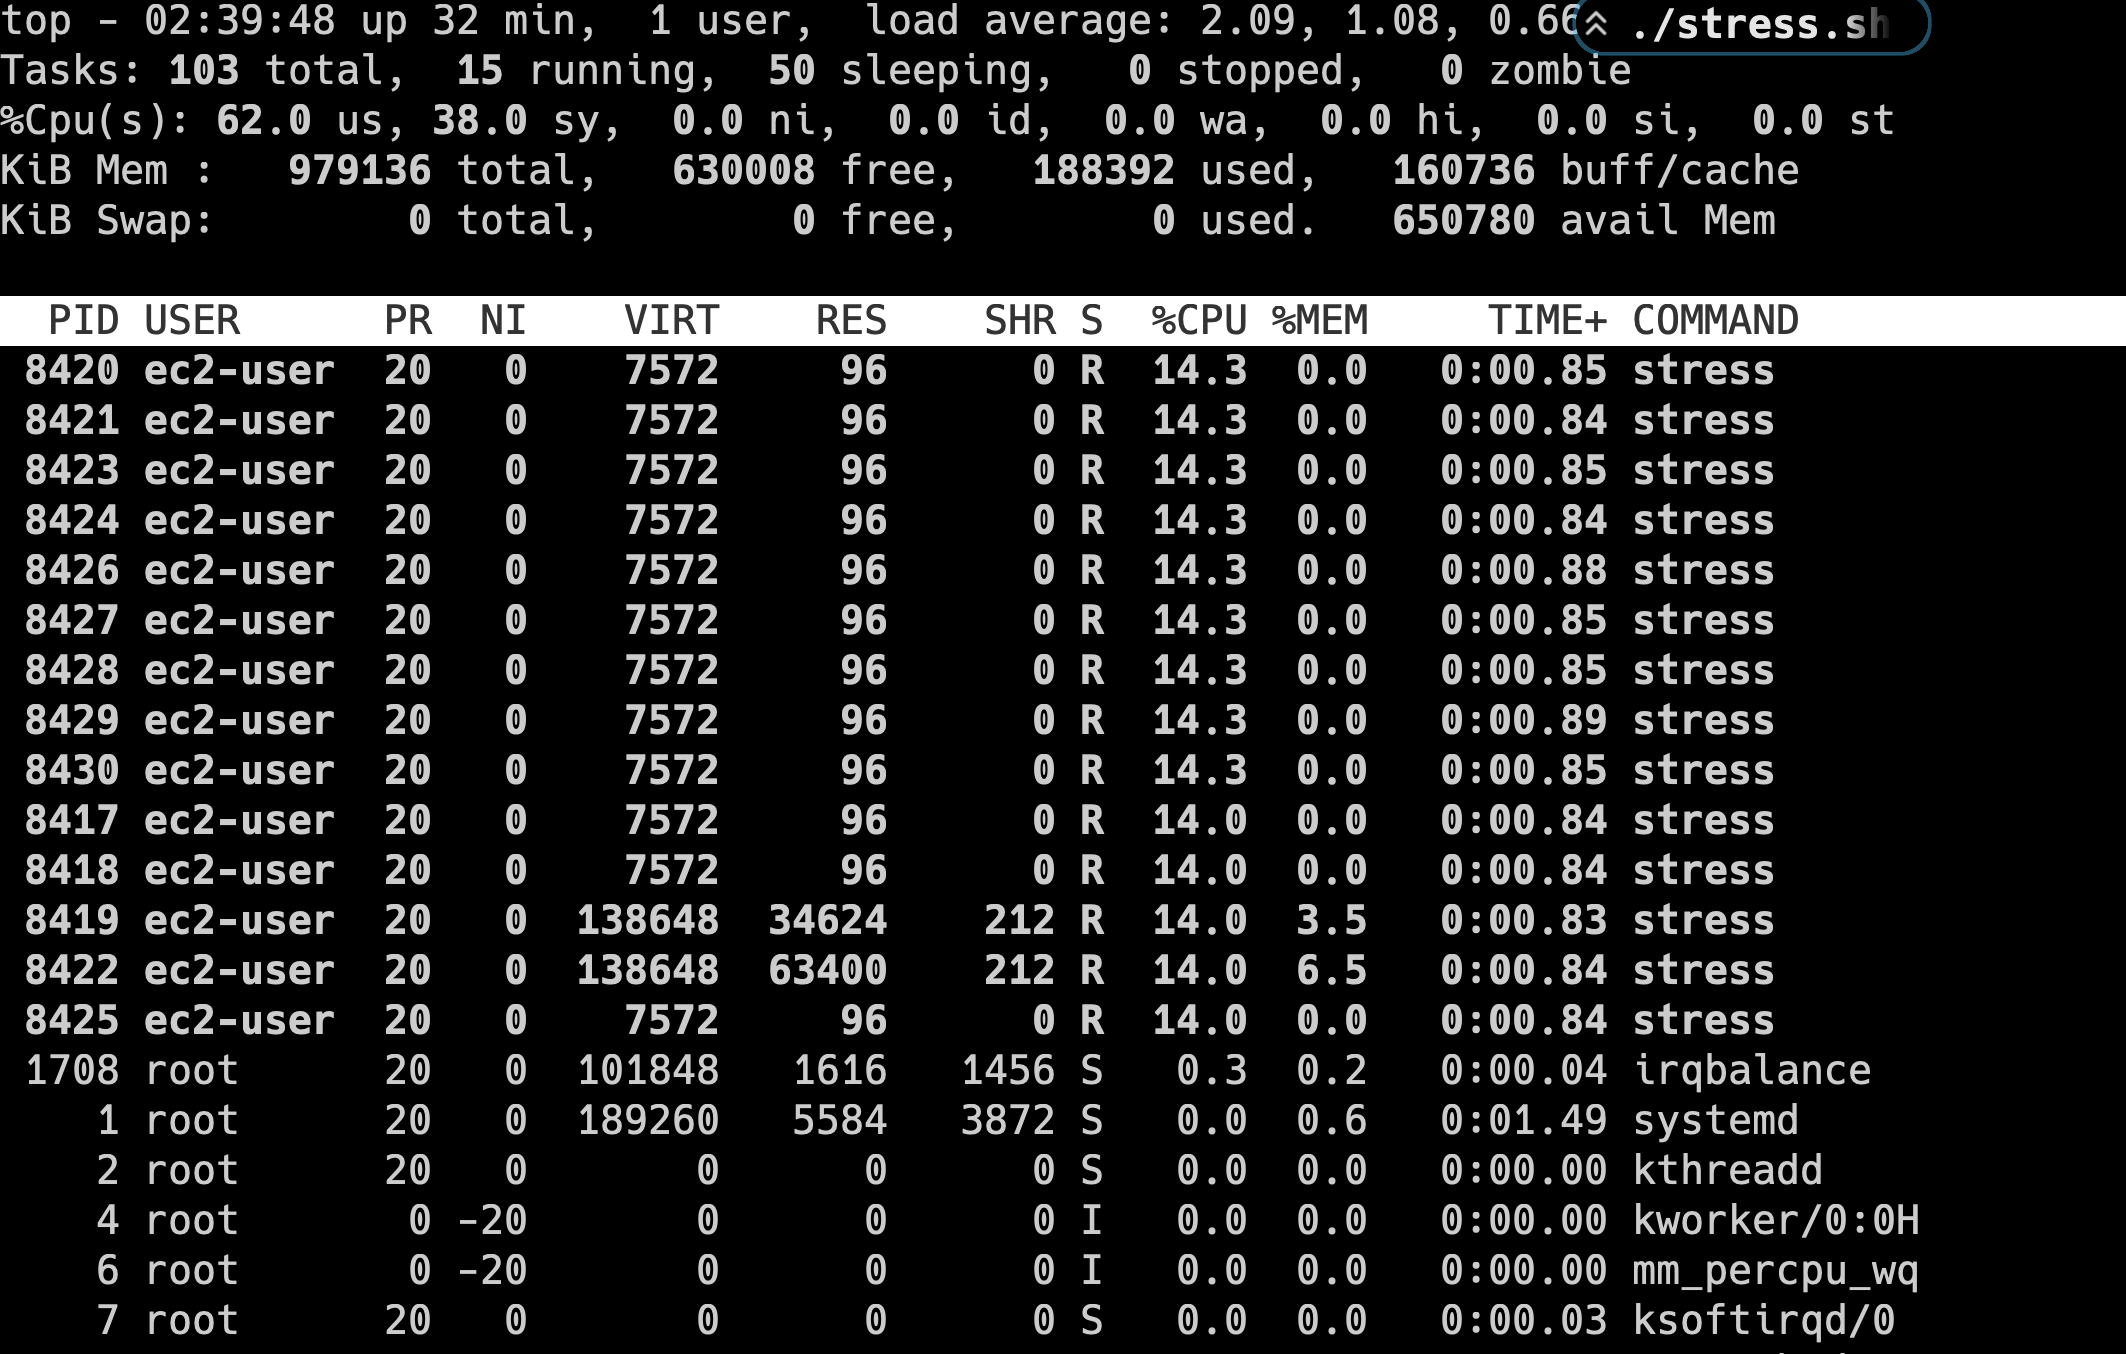 High CPU usage after running script