Monitoring an EC2 Instance
Project Overview
Logging and monitoring are techniques implemented to achieve a common
goal. They work together to help ensure that a system's performance
baselines and security guidelines are always met.
Logging refers to recording and storing data events as log files. Logs
contain low-level details that can give you visibility into how your
application or system performs under certain circumstances. From a
security standpoint, logging helps security administrators identify red
flags that are easily overlooked in their system.
Monitoring is the process of analyzing and collecting data to help
ensure optimal performance. Monitoring helps detect unauthorized access
and helps align your services' usage with organizational security.
In this project, I created an Amazon CloudWatch alarm that initiates
when the Amazon Elastic Compute Cloud (Amazon EC2) instance exceeds a
specific central processing unit (CPU) utilization threshold. I created
a subscription using Amazon Simple Notification Service (Amazon SNS)
that sends an email to me if this alarm goes off. I logged in to the EC2
instance and ran a stress test command that caused the CPU utilization
of the EC2 instance to reach 100 percent.
This test simulated a malicious actor gaining control of the EC2
instance and spiking the CPU. CPU spiking has various possible causes,
one of which is malware.
What I Accomplished
- Created an Amazon SNS notification
- Configured a CloudWatch alarm
- Stress tested an EC2 instance
- Confirmed that an Amazon SNS email was sent
- Created a CloudWatch dashboard
Task 1: Configure Amazon SNS
In this task, I created an SNS topic and then subscribed to it with my
email address.
Amazon SNS is a fully managed messaging service for both
application-to-application (A2A) and application-to-person (A2P)
communication.
-
In the AWS Management Console, I entered SNS in the search bar, and
then chose Simple Notification Service.
-
On the left, I chose the button, chose Topics, and then chose Create
topic.
-
On the Create topic page in the Details section, I configured the
following options:
- Type: I chose Standard.
- Name: I entered MyCwAlarm
- I chose Create topic.
-
On the MyCwAlarm details page, I chose the Subscriptions tab, and then
chose Create subscription.
-
On the Create subscription page in the Details section, I configured
the following options:
- Topic ARN: I left the default option selected.
- Protocol: From the dropdown list, I chose Email.
- Endpoint: I entered my email address that I could access.
- I chose Create subscription.
-
In the Details section, the Status showed Pending confirmation. I
received an AWS Notification - Subscription Confirmation email message
at the email address that I provided in the previous step.
-
I opened the email that I received with the Amazon SNS subscription
notification, and chose Confirm subscription.
-
I went back to the AWS Management Console. In the left navigation
pane, I chose Subscriptions.
- The Status now showed Confirmed.
At this point, my SNS topic was now able to send alerts to the email
address that I associated with the Amazon SNS subscription.
Task 2: Create a CloudWatch alarm
In this task, I viewed some metrics and logs stored within CloudWatch. I
then created a CloudWatch alarm to initiate and send an email to my SNS
topic if the Stress Test EC2 instance increased to more than 60 percent
CPU utilization.
CloudWatch is a monitoring and observability service built for DevOps
engineers, developers, site reliability engineers (SREs), IT managers,
and product owners. CloudWatch provides you with data and actionable
insights to monitor your applications, respond to system-wide
performance changes, and optimize resource utilization. CloudWatch
collects monitoring and operational data in the form of logs, metrics,
and events. You get a unified view of operational health and gain
visibility of your AWS resources, applications, and services running on
AWS and on premises.
-
In the AWS Management Console, I entered Cloudwatch in the search bar,
and then chose it.
-
In the left navigation pane, I chose the Metrics dropdown list, and
then chose All metrics.
CloudWatch usually takes 5-10 minutes after the creation of an EC2
instance to start fetching metric details.
-
On the Metrics page, I chose EC2, and chose Per-Instance Metrics.
-
From this page, I could view all the metrics being logged and the
specific EC2 instance for the metrics.
-
I selected the check box with CPUUtilization as the Metric name for
the Stress Test EC2 instance.
This option displayed the graph for the CPU utilization metric, which
was approximately 0 because nothing had been done yet.
-
In the left navigation pane, I chose the Alarms dropdown list, and
then chose All alarms.
I now created a metric alarm. A metric alarm watches a single CloudWatch
metric or the result of a math expression based on CloudWatch metrics.
The alarm performs one or more actions based on the value of the metric
or expression relative to a threshold over a number of time periods. The
action then sends a notification to the SNS topic that I created
earlier.
- I chose Create alarm.
-
I chose Select metric, chose EC2, and then chose Per-Instance Metrics.
-
I selected the check box with CPUUtilization as the Metric name for
the Stress Test instance name.
- I chose Select metric.
-
On the Specify metric and conditions page, I configured the following
options:
-
Metric
-
Metric name: I entered
CPUUtilization
- InstanceId: I left the default option selected.
-
Statistic: I entered Average
-
Period: From the dropdown list, I chose
1 minute.
-
Conditions
-
Threshold type: I chose
Static.
-
Whenever CPUUtilization is...: I chose
Greater > threshold.
-
than... Define the threshold value: I entered
60
- I chose Next.
-
On the Configure actions page, I configured the following options:
-
Notification
-
Alarm state trigger: I chose
In alarm.
-
Select an SNS topic: I chose
Select an existing SNS topic.
-
Send a notification to...: I chose the text box, and then
chose MyCwAlarm.
-
I chose Next, and then configured the following options:
-
Name and description
-
Alarm name: I entered
LabCPUUtilizationAlarm
-
Alarm description - optional: I entered
CloudWatch alarm for Stress Test EC2 instance
CPUUtilization
- I chose Next
-
I reviewed the Preview and create page, and then chose Create alarm.
At this point, I had viewed some Amazon EC2 metrics within CloudWatch
and created a CloudWatch alarm that initiates an In alarm state when the
CPU utilization threshold exceeds 60 percent.
Task 3: Test the Cloudwatch alarm
In this task, I logged in to the Stress Test EC2 instance and ran a
command that stressed the CPU load to 100 percent. This increase in CPU
utilization activated the CloudWatch alarm, which caused Amazon SNS to
send an email notification to the email address associated with the SNS
topic.
-
I navigated to the Vocareum console page, and chose the AWS Details
button.
-
Next to EC2InstanceURL, there was a link. I copied and pasted this
link into a new browser tab.
This link connected me to the Stress Test EC2 instance.
-
To manually increase the CPU load of the EC2 instance, I ran the
following command:
sudo stress --cpu 10 -v --timeout 400s
This command runs for 400 seconds, loads the CPU to 100 percent, and
then decreases the CPU to 0 percent after the allotted time.
-
I navigated to the Vocareum console page, and chose the AWS Details
button.
-
I copied and pasted the URL text next to EC2InstanceURL into another
new browser tab to open a second terminal for the Stress Test
instance.
-
In the new terminal, I ran the following command:
top
This command showed the live CPU usage.
-
I navigated back to the AWS console where I had the CloudWatch Alarms
page open.
- I chose LabCPUUtilizationAlarm.
-
I monitored the graph while selecting the refresh button every 1
minute until the alarm status changed to In alarm.
It took a few minutes for the alarm status to change to In alarm and for
an email to be sent.
On the graph, I could see where CPUUtilization had increased above the
60 percent threshold.
-
I navigated to my email inbox for the email address that I used to
configure the Amazon SNS subscription. I received a new email
notification from AWS Notifications.
At this point, I had run a command to load the EC2 instance to 100
percent for 400 seconds. This increase in CPU utilization activated the
alarm to go into the In alarm state, and I confirmed the spike in the
CPU utilization by viewing the CloudWatch graph. I also received an
email notification alerting me of the In alarm state.
Task 4: Create a CloudWatch dashboard
In this task, I created a CloudWatch dashboard using the same
CPUUtilization metrics that I had used throughout this project.
CloudWatch dashboards are customizable home pages in the CloudWatch
console that you can use to monitor your resources in a single view.
With CloudWatch dashboards, you can even monitor resources that are
spread across different Regions. You can use CloudWatch dashboards to
create customized views of the metrics and alarms for your AWS
resources.
-
I went to the CloudWatch section in the AWS console. In the left
navigation pane, I chose Dashboards.
- I chose Create dashboard.
-
For Dashboard name, I entered
LabEC2Dashboard and then chose Create
dashboard.
- I chose Line.
- I chose Metrics.
- I chose EC2, and then chose Per-Instance Metrics.
-
I selected the check box with Stress Test for the Instance name and
CPUUtilization for the Metric name.
- I chose Create widget.
- I chose Save dashboard.
Now I had created a quick access shortcut to view the CPUUtilization
metric for the Stress Test instance.
Project Summary
In this project, I created a CloudWatch alarm that activated when the
Stress Test instance exceeded a specific CPU utilization threshold. I
created a subscription using Amazon SNS that sent an email to me if this
alarm went off. I logged in to the EC2 instance and ran a stress test
command that spiked the EC2 instance to 100 percent CPU utilization.
This test simulated what could happen if a malicious actor were to gain
control of an EC2 instance and spike CPU utilization. CPU spiking has
various possible causes, one of which is malware.
What I Accomplished
- Created an Amazon SNS notification
- Configured a Cloudwatch alarm
- Stress tested an EC2 instance
- Confirmed that an Amazon SNS email was sent
- Created a CloudWatch dashboard
×
![]()
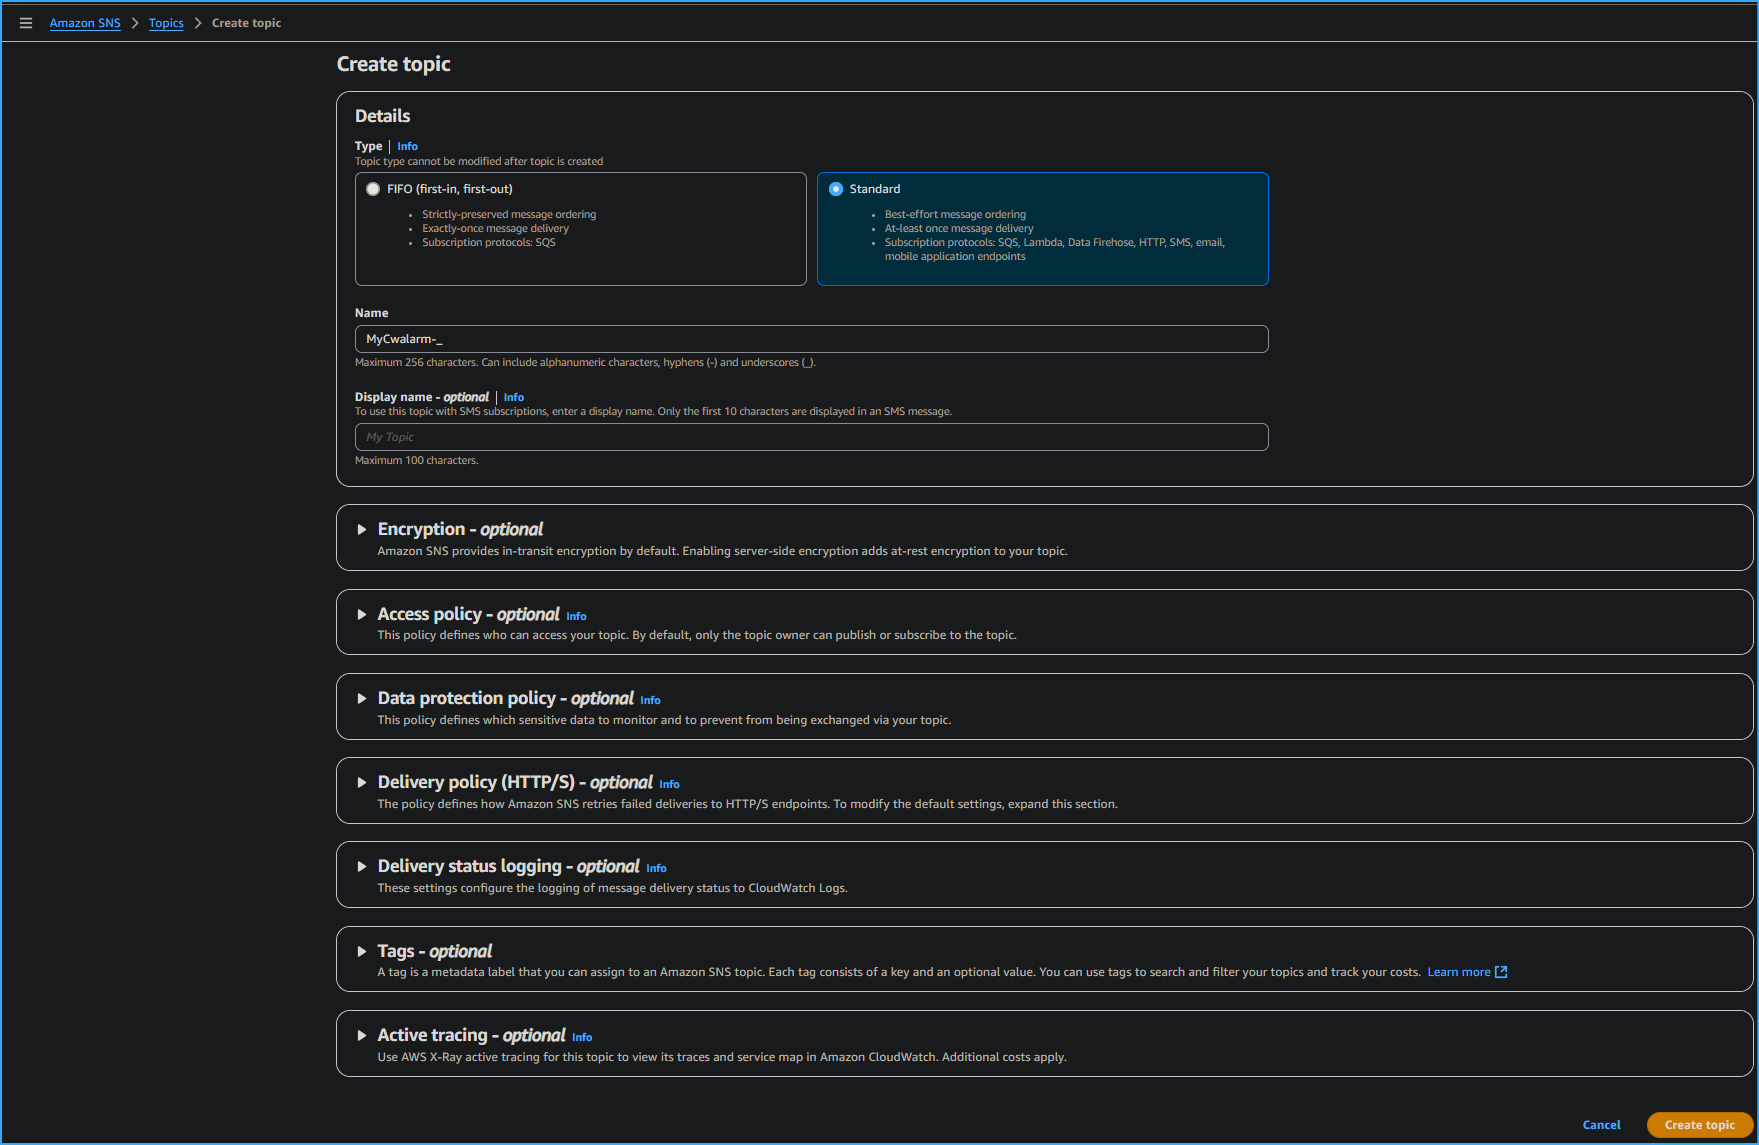 Creating Topic
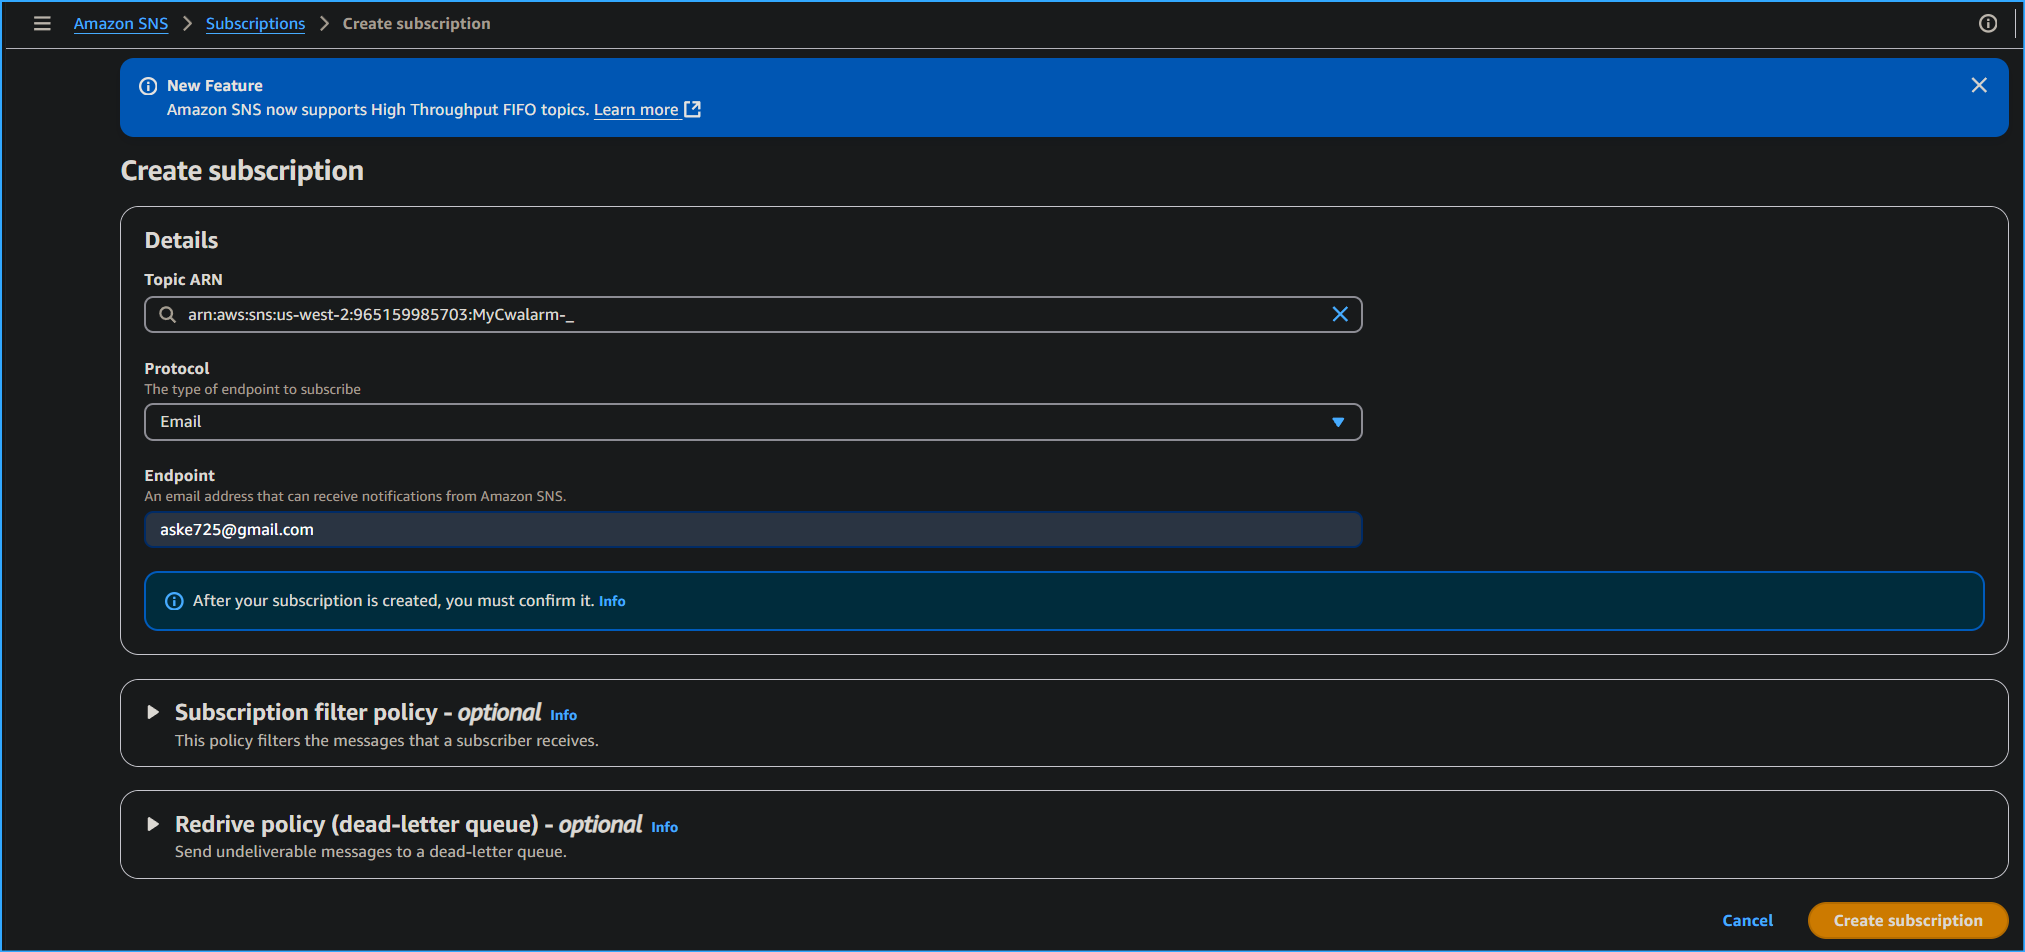 Creating CWAlarm Subscription
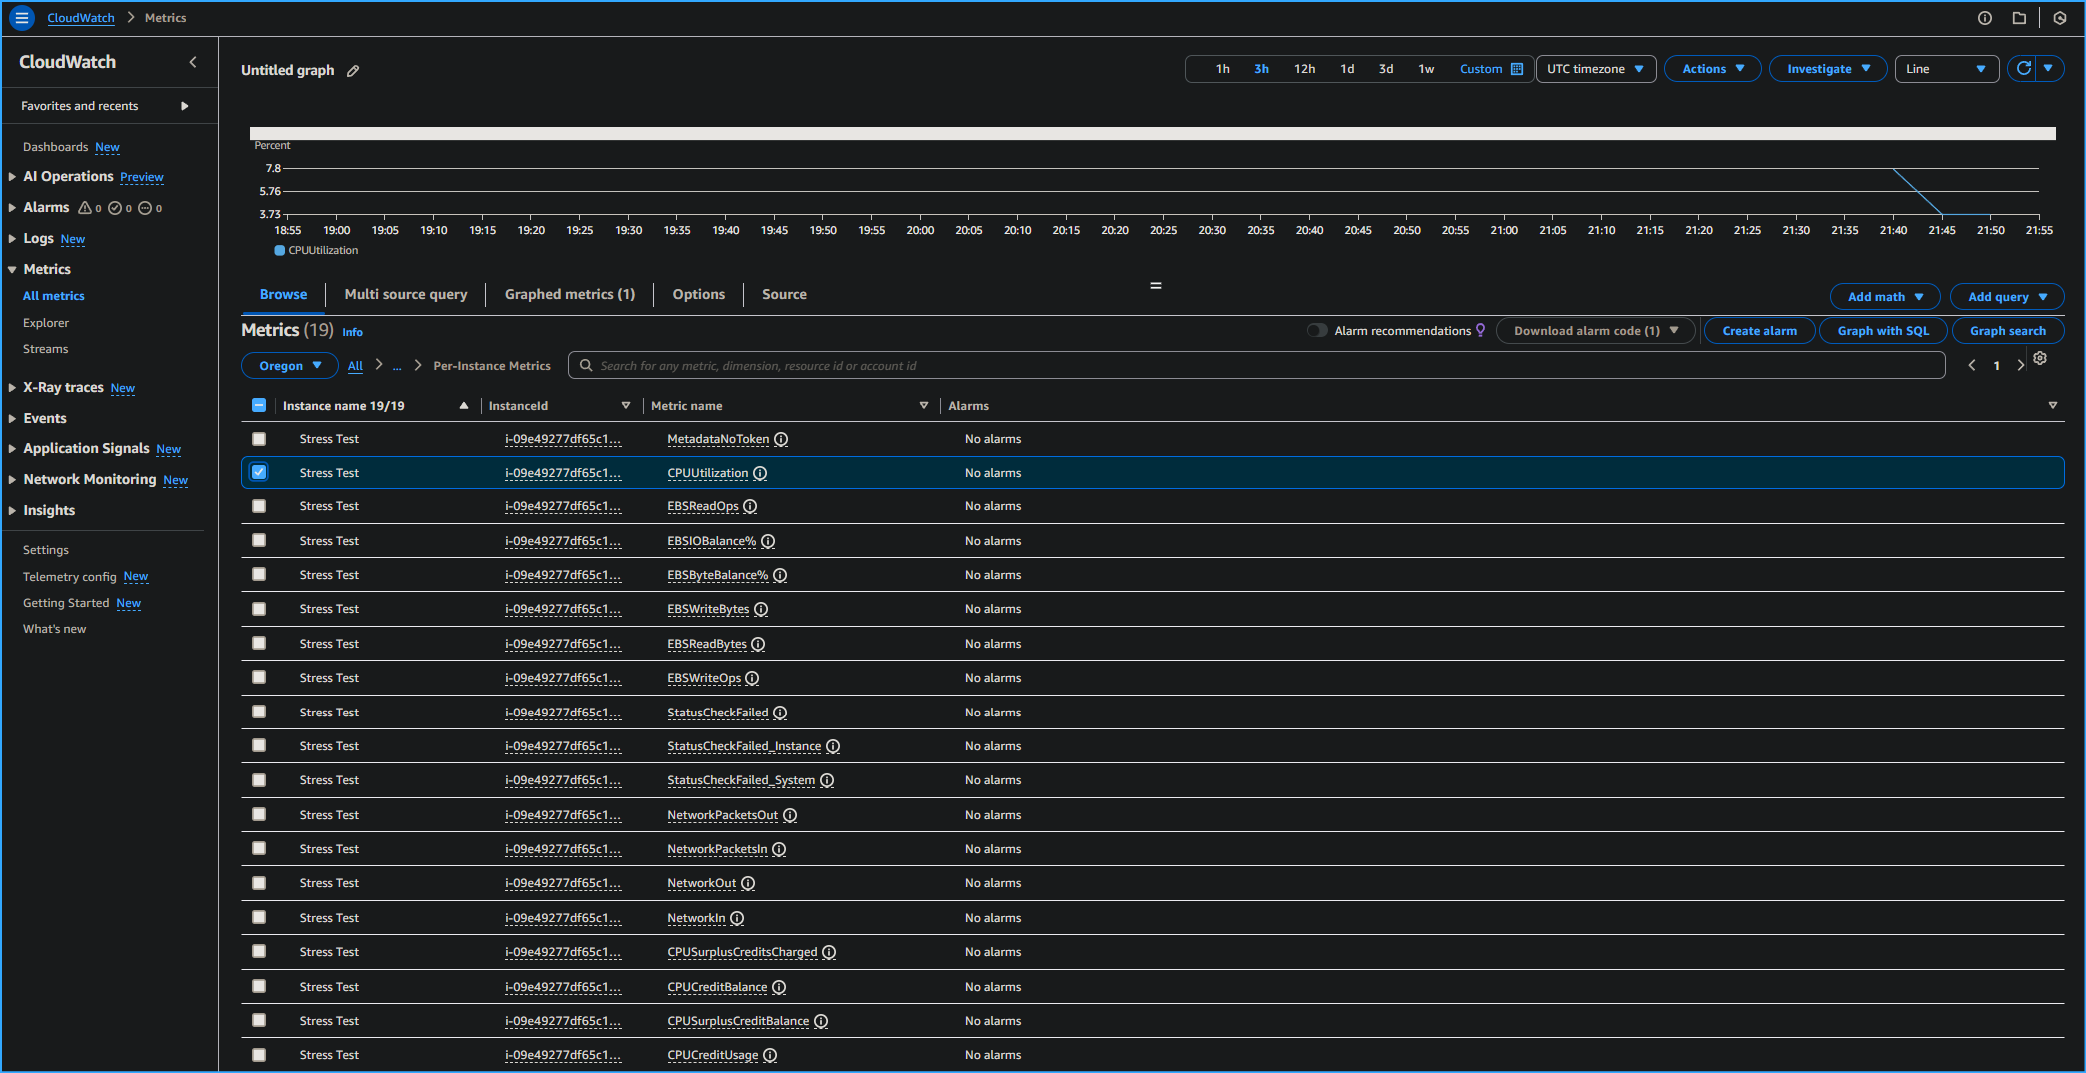 Selected CPU Utilization Stress Test in CloudWatch Metrics
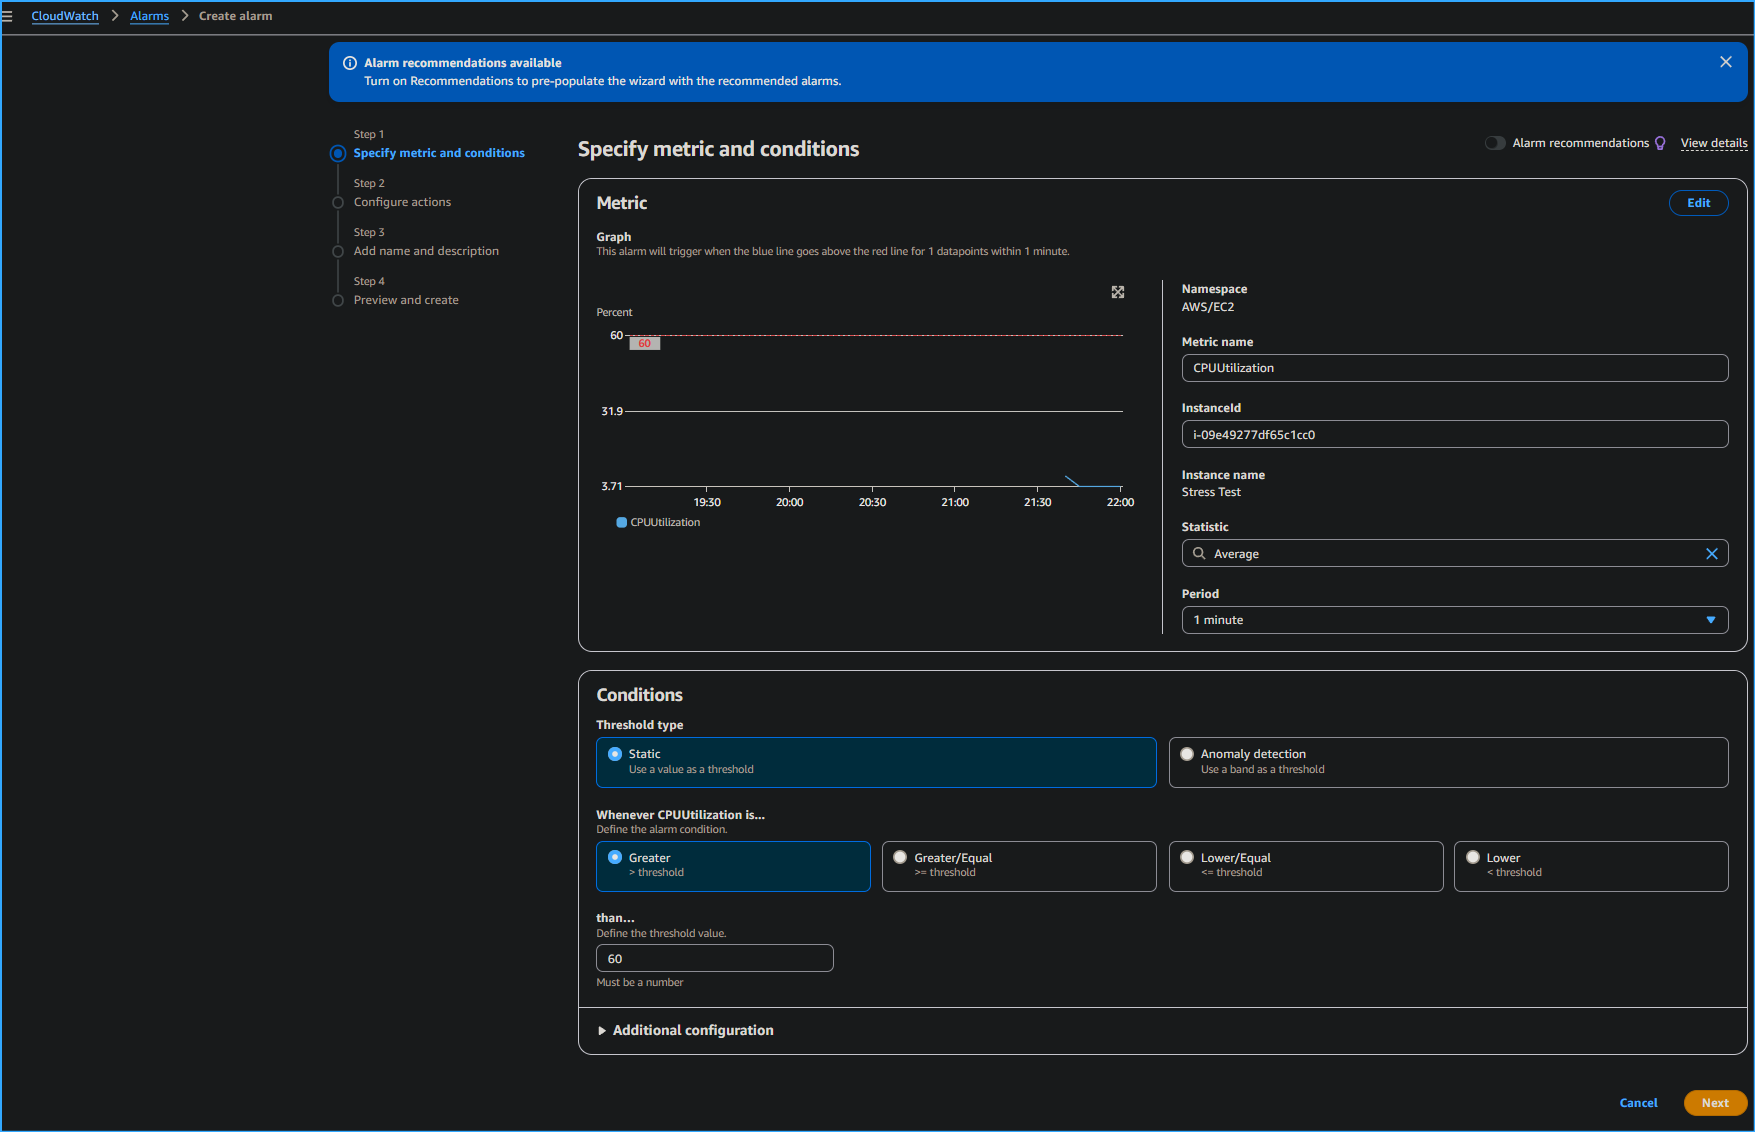 Specifying Metrics and Conditions for CPU Utilization CloudWatch
Alarm
Specifying Metrics and Conditions for CPU Utilization CloudWatch
Alarm
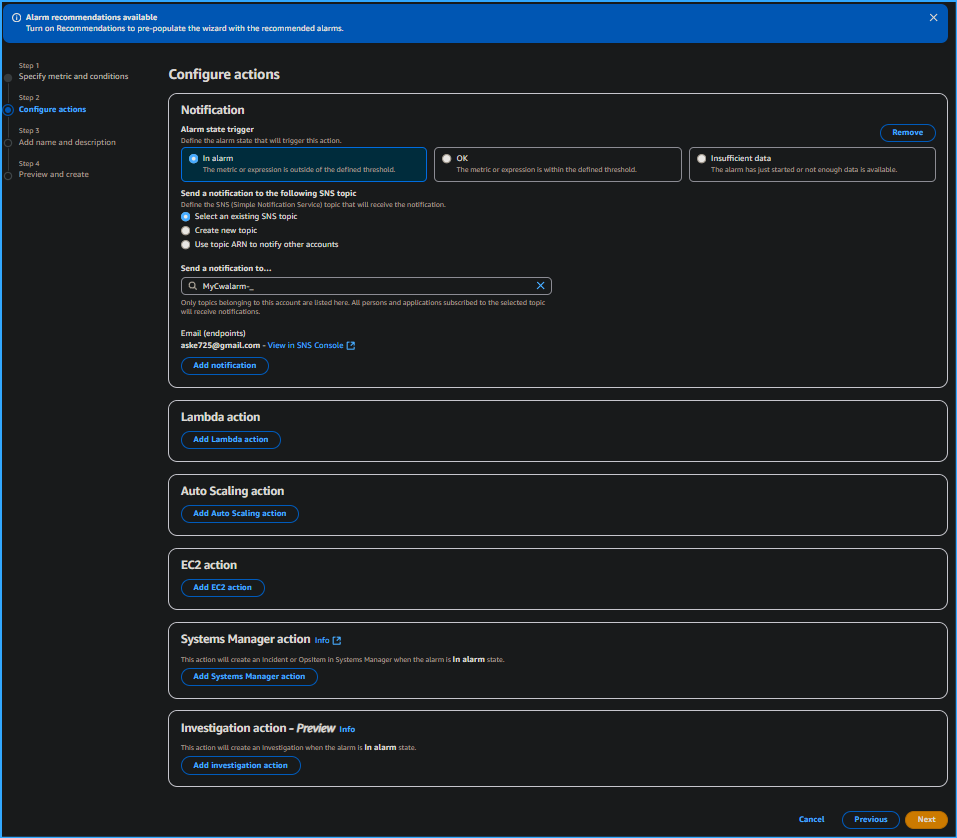 Configuring Actions Sending SNS Topic Notifications to Email
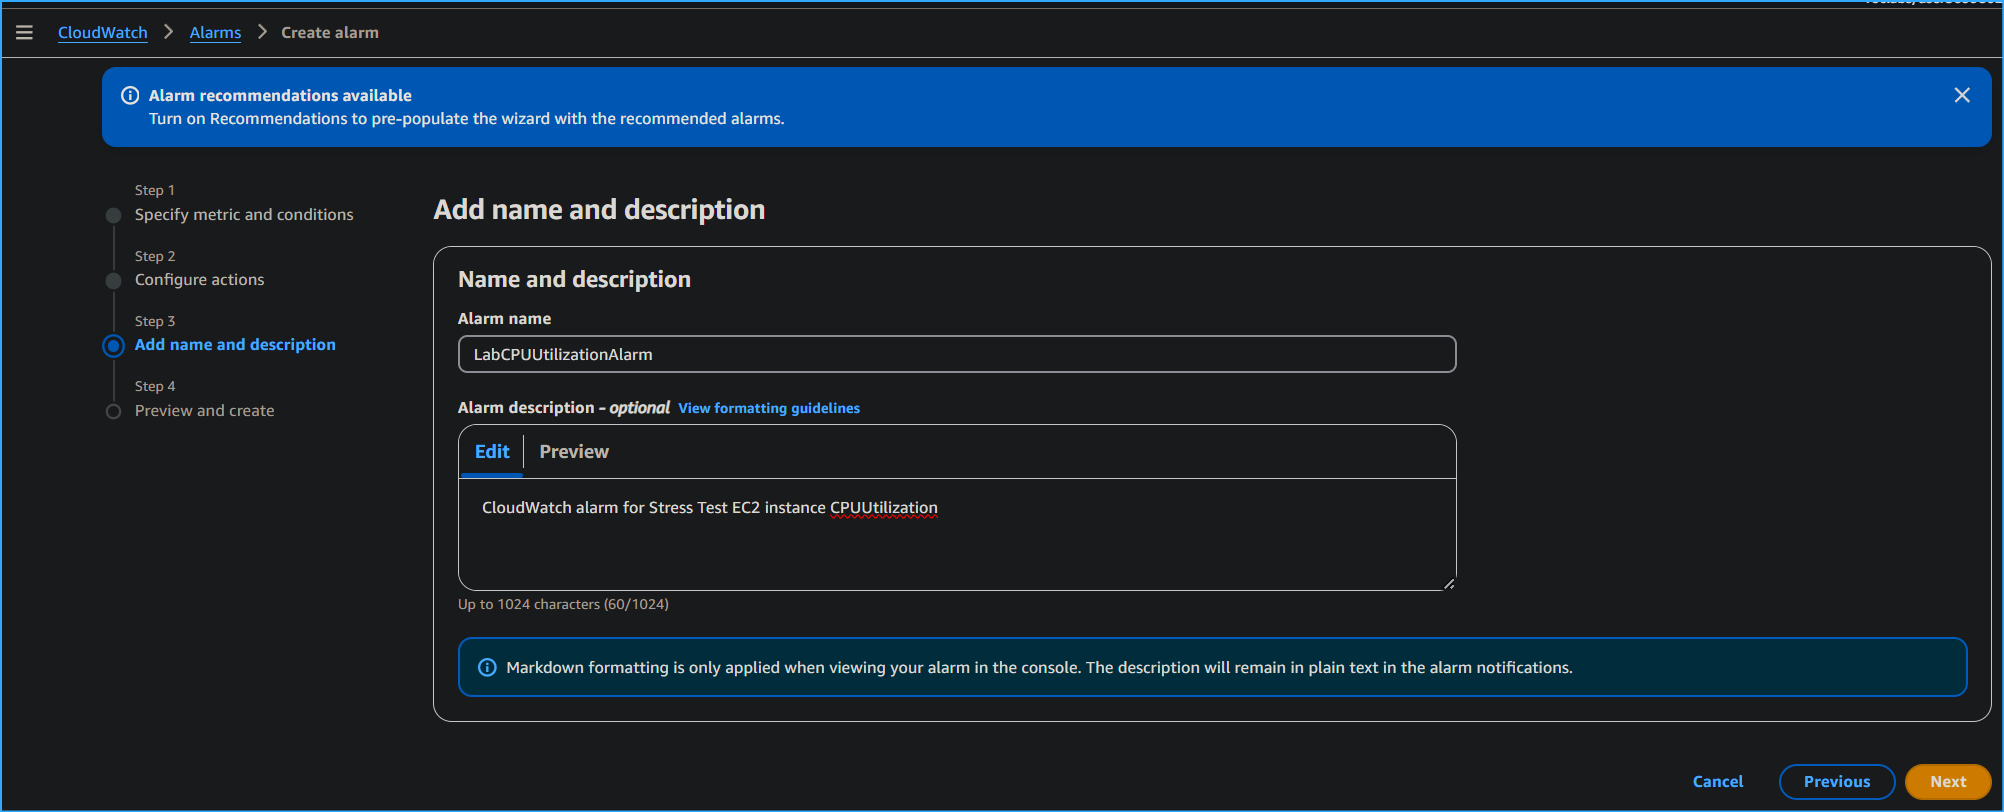 Setting Alarm Name and Subscription
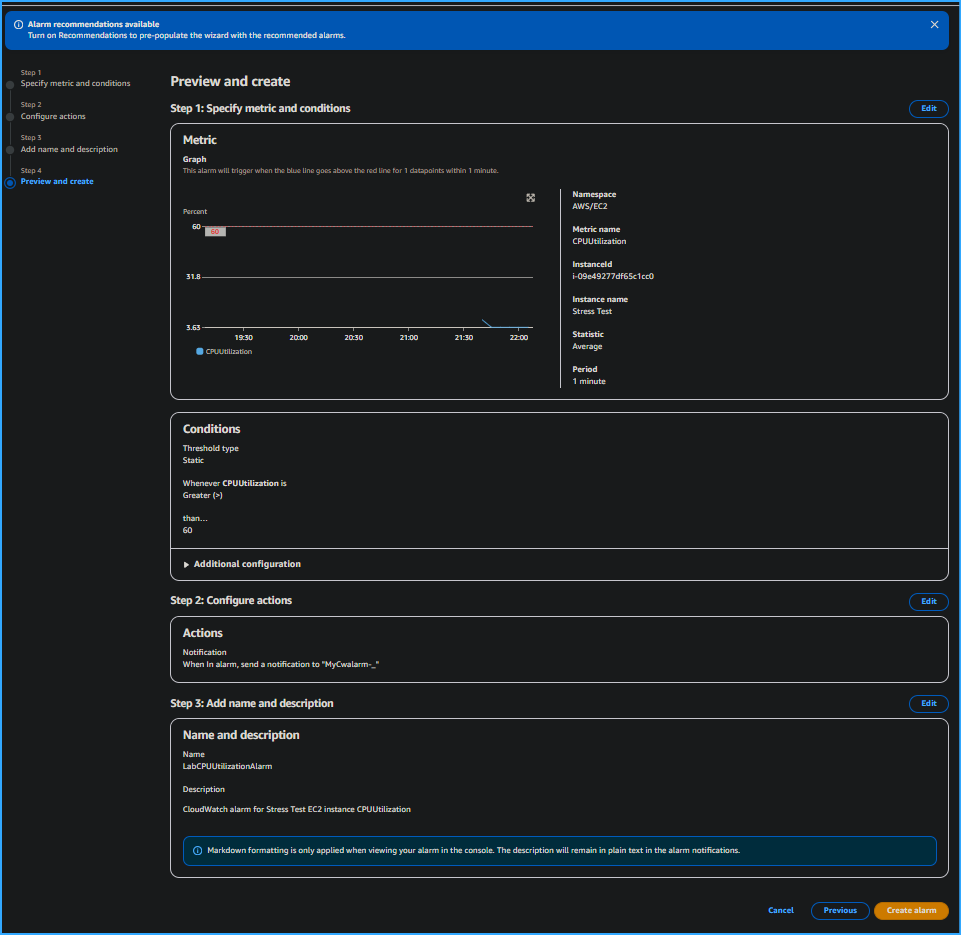 Preview and Create Alarm Page
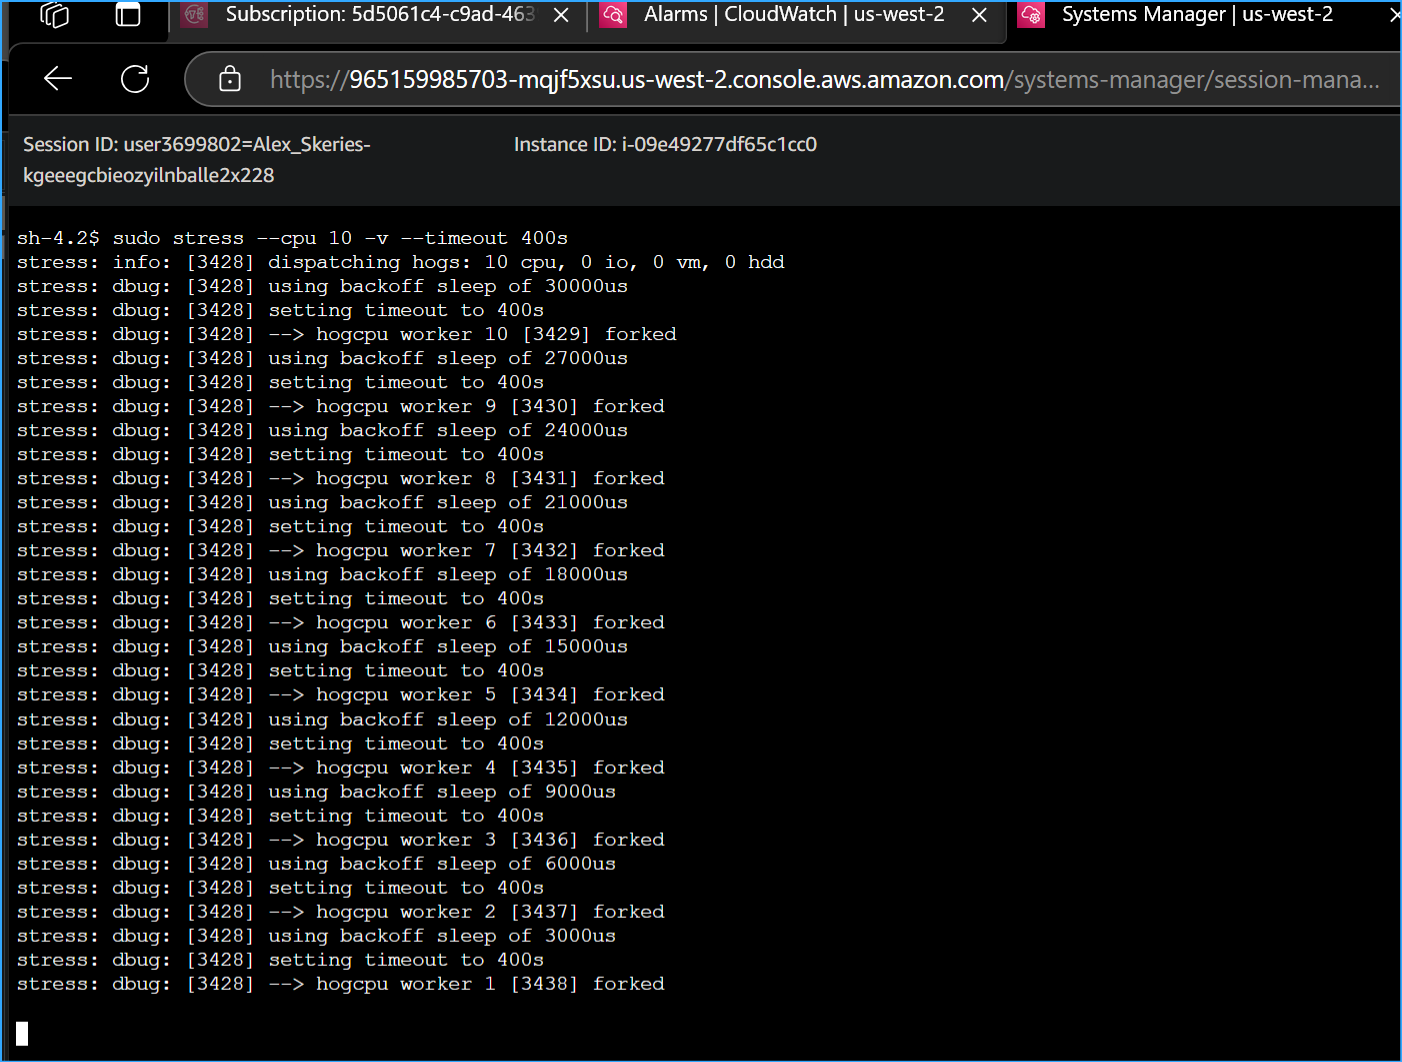 Manually Increased CPU Load of Instance with this CMD
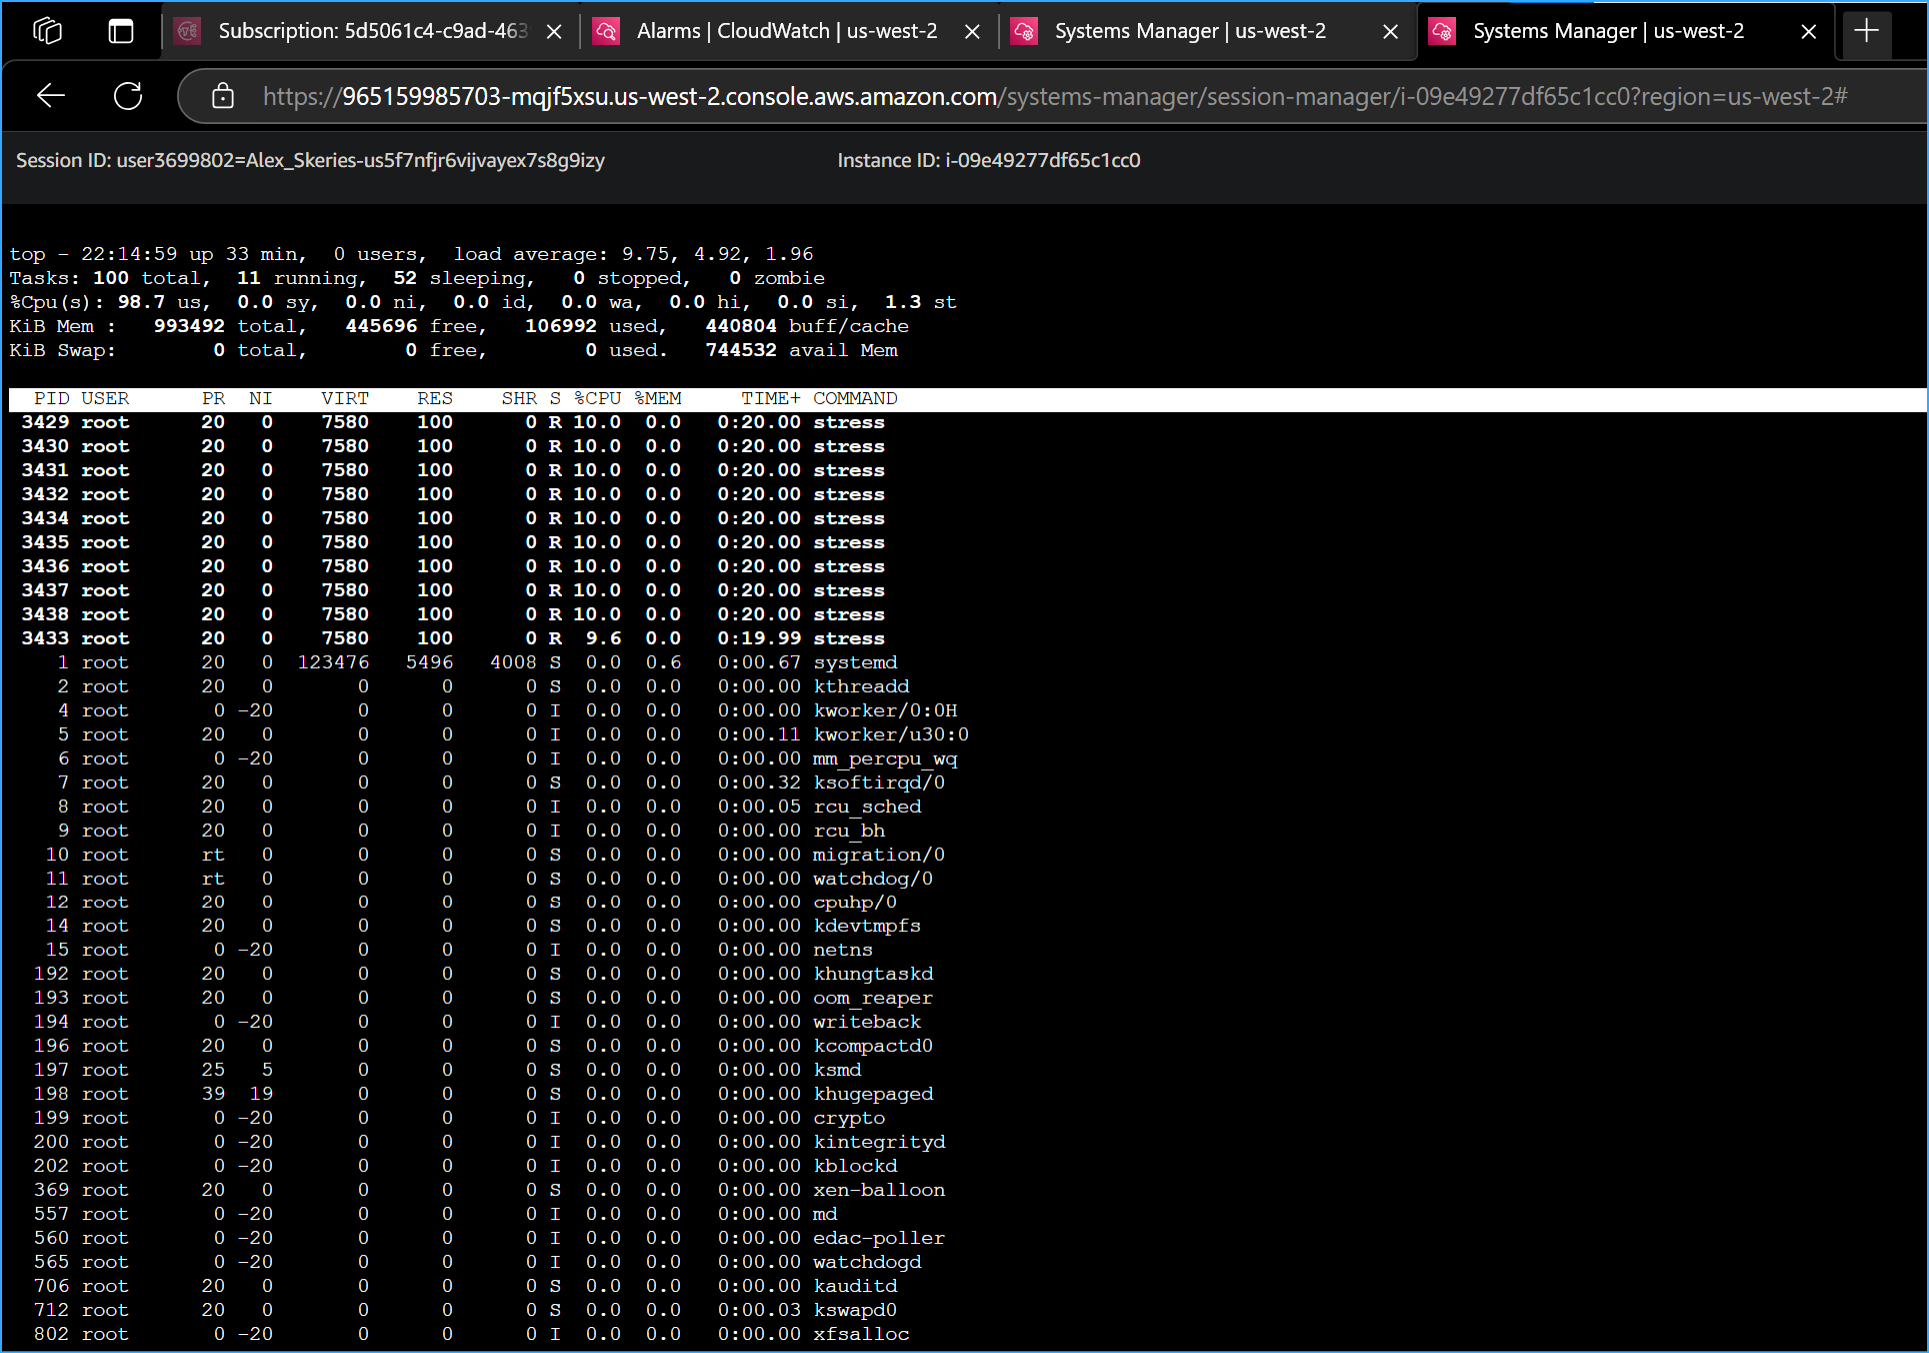 Entered Top CMD in New Terminal to Show Live CPU Usage
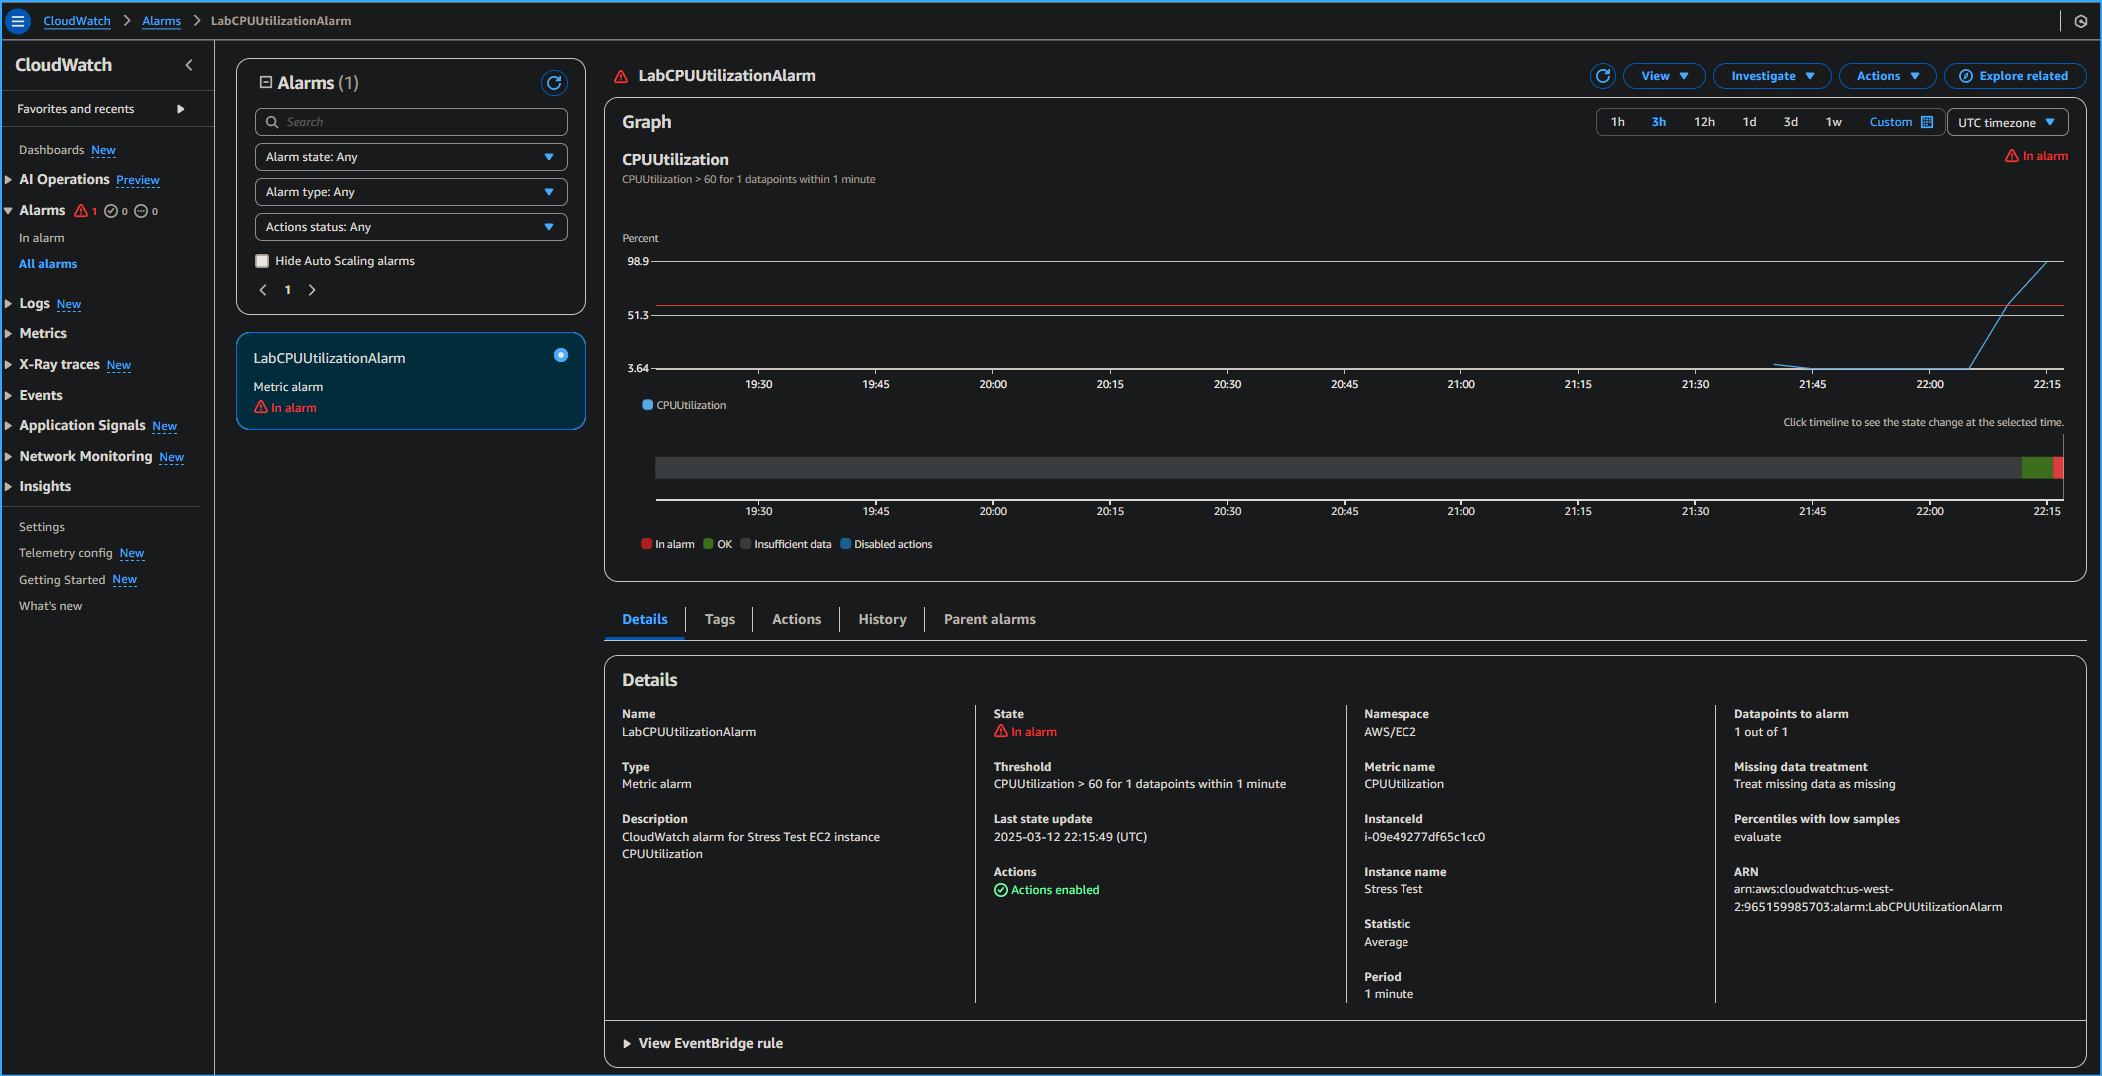 CPU Utilization Alarm in CloudWatch Metrics
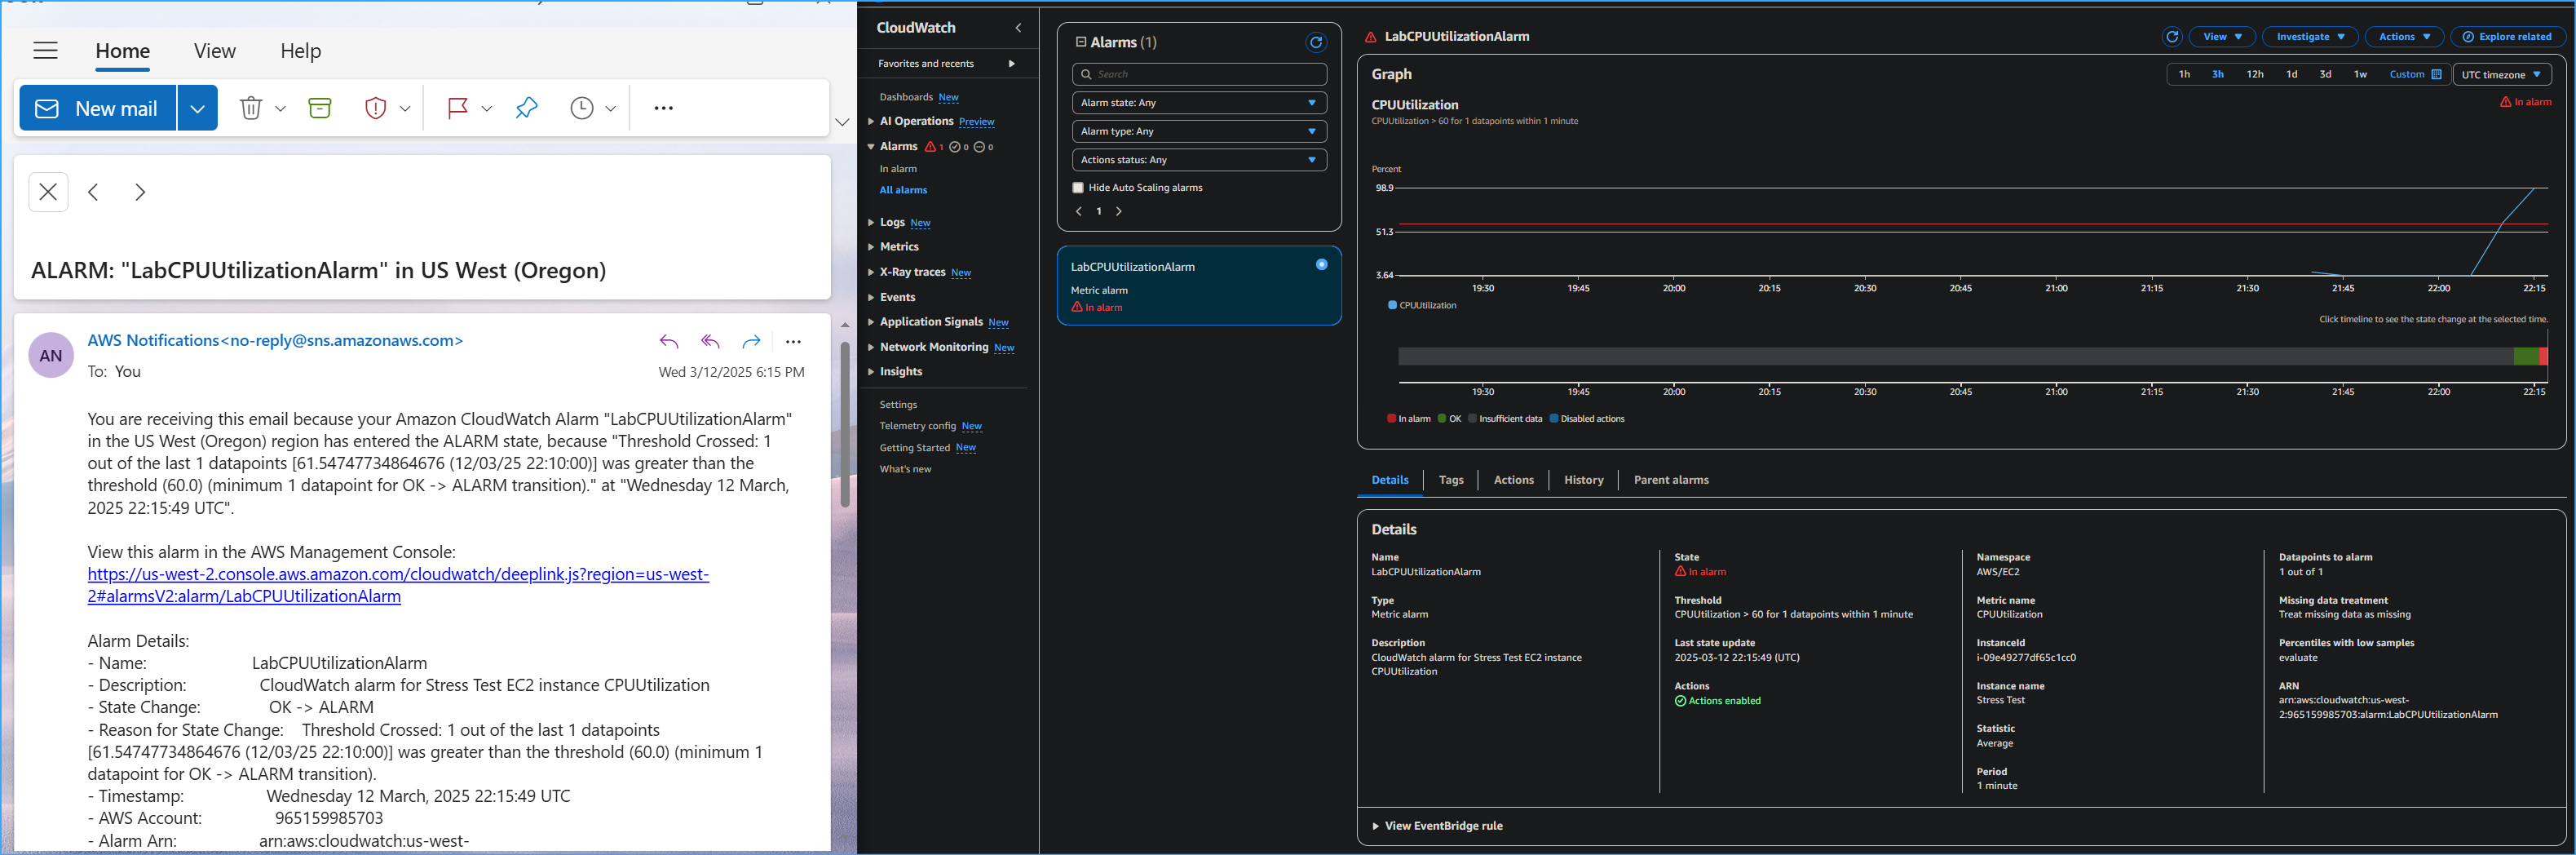 CPU Utilization Alarm in CloudWatch Metrics and SNS Email
Notification
CPU Utilization Alarm in CloudWatch Metrics and SNS Email
Notification
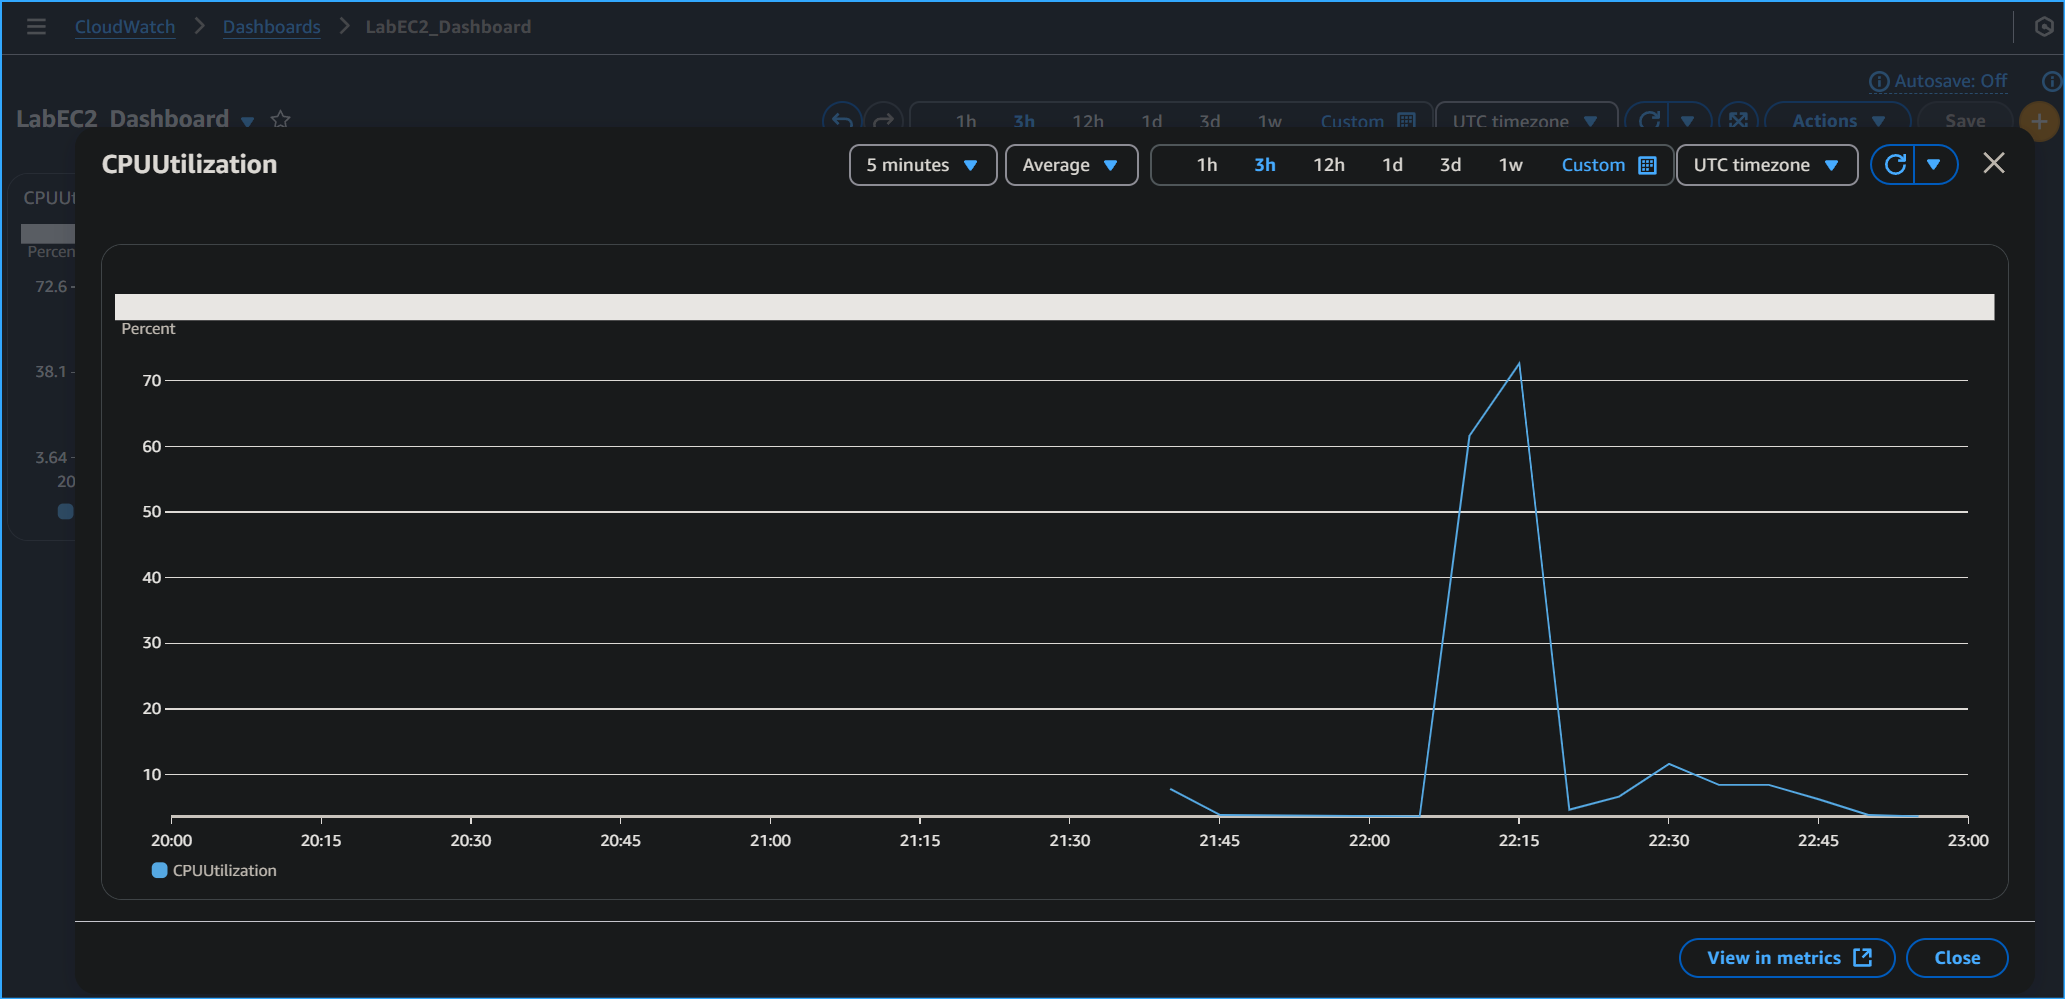 Created Dashboard and Widget as Quick Access Shortcut to View
Metrics
Created Dashboard and Widget as Quick Access Shortcut to View
Metrics